Blog
Browse the Blog and customer stories to find what you need to succeed with Atlas.
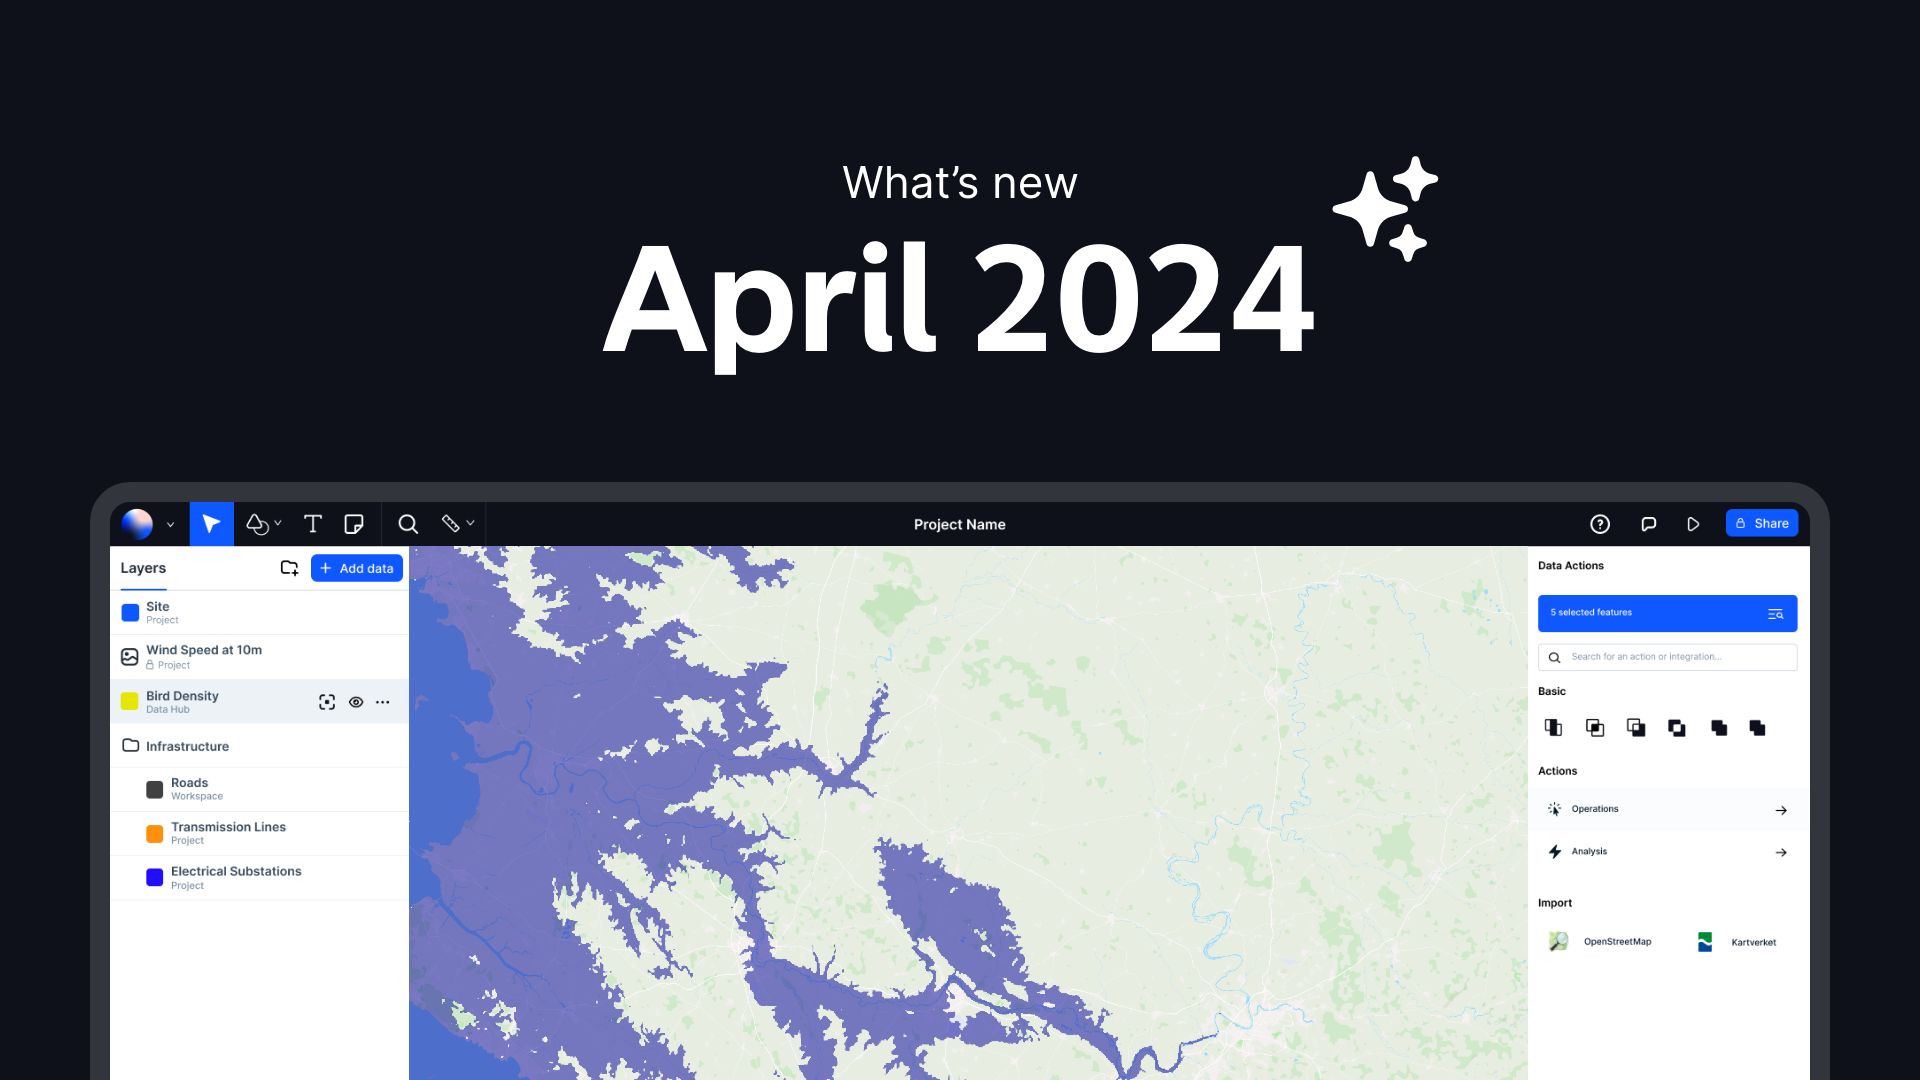
Release Notes: April 2024
This April, we’ve turbocharged Atlas with a lot of new features to ensure you have the best tools at your fingertips. Dive into the summary below, and keep reading for a detailed rundown of each enhancement. We're committed to relentlessly improving and expanding our capabilities to ensure you have the best tools at your fingertips.
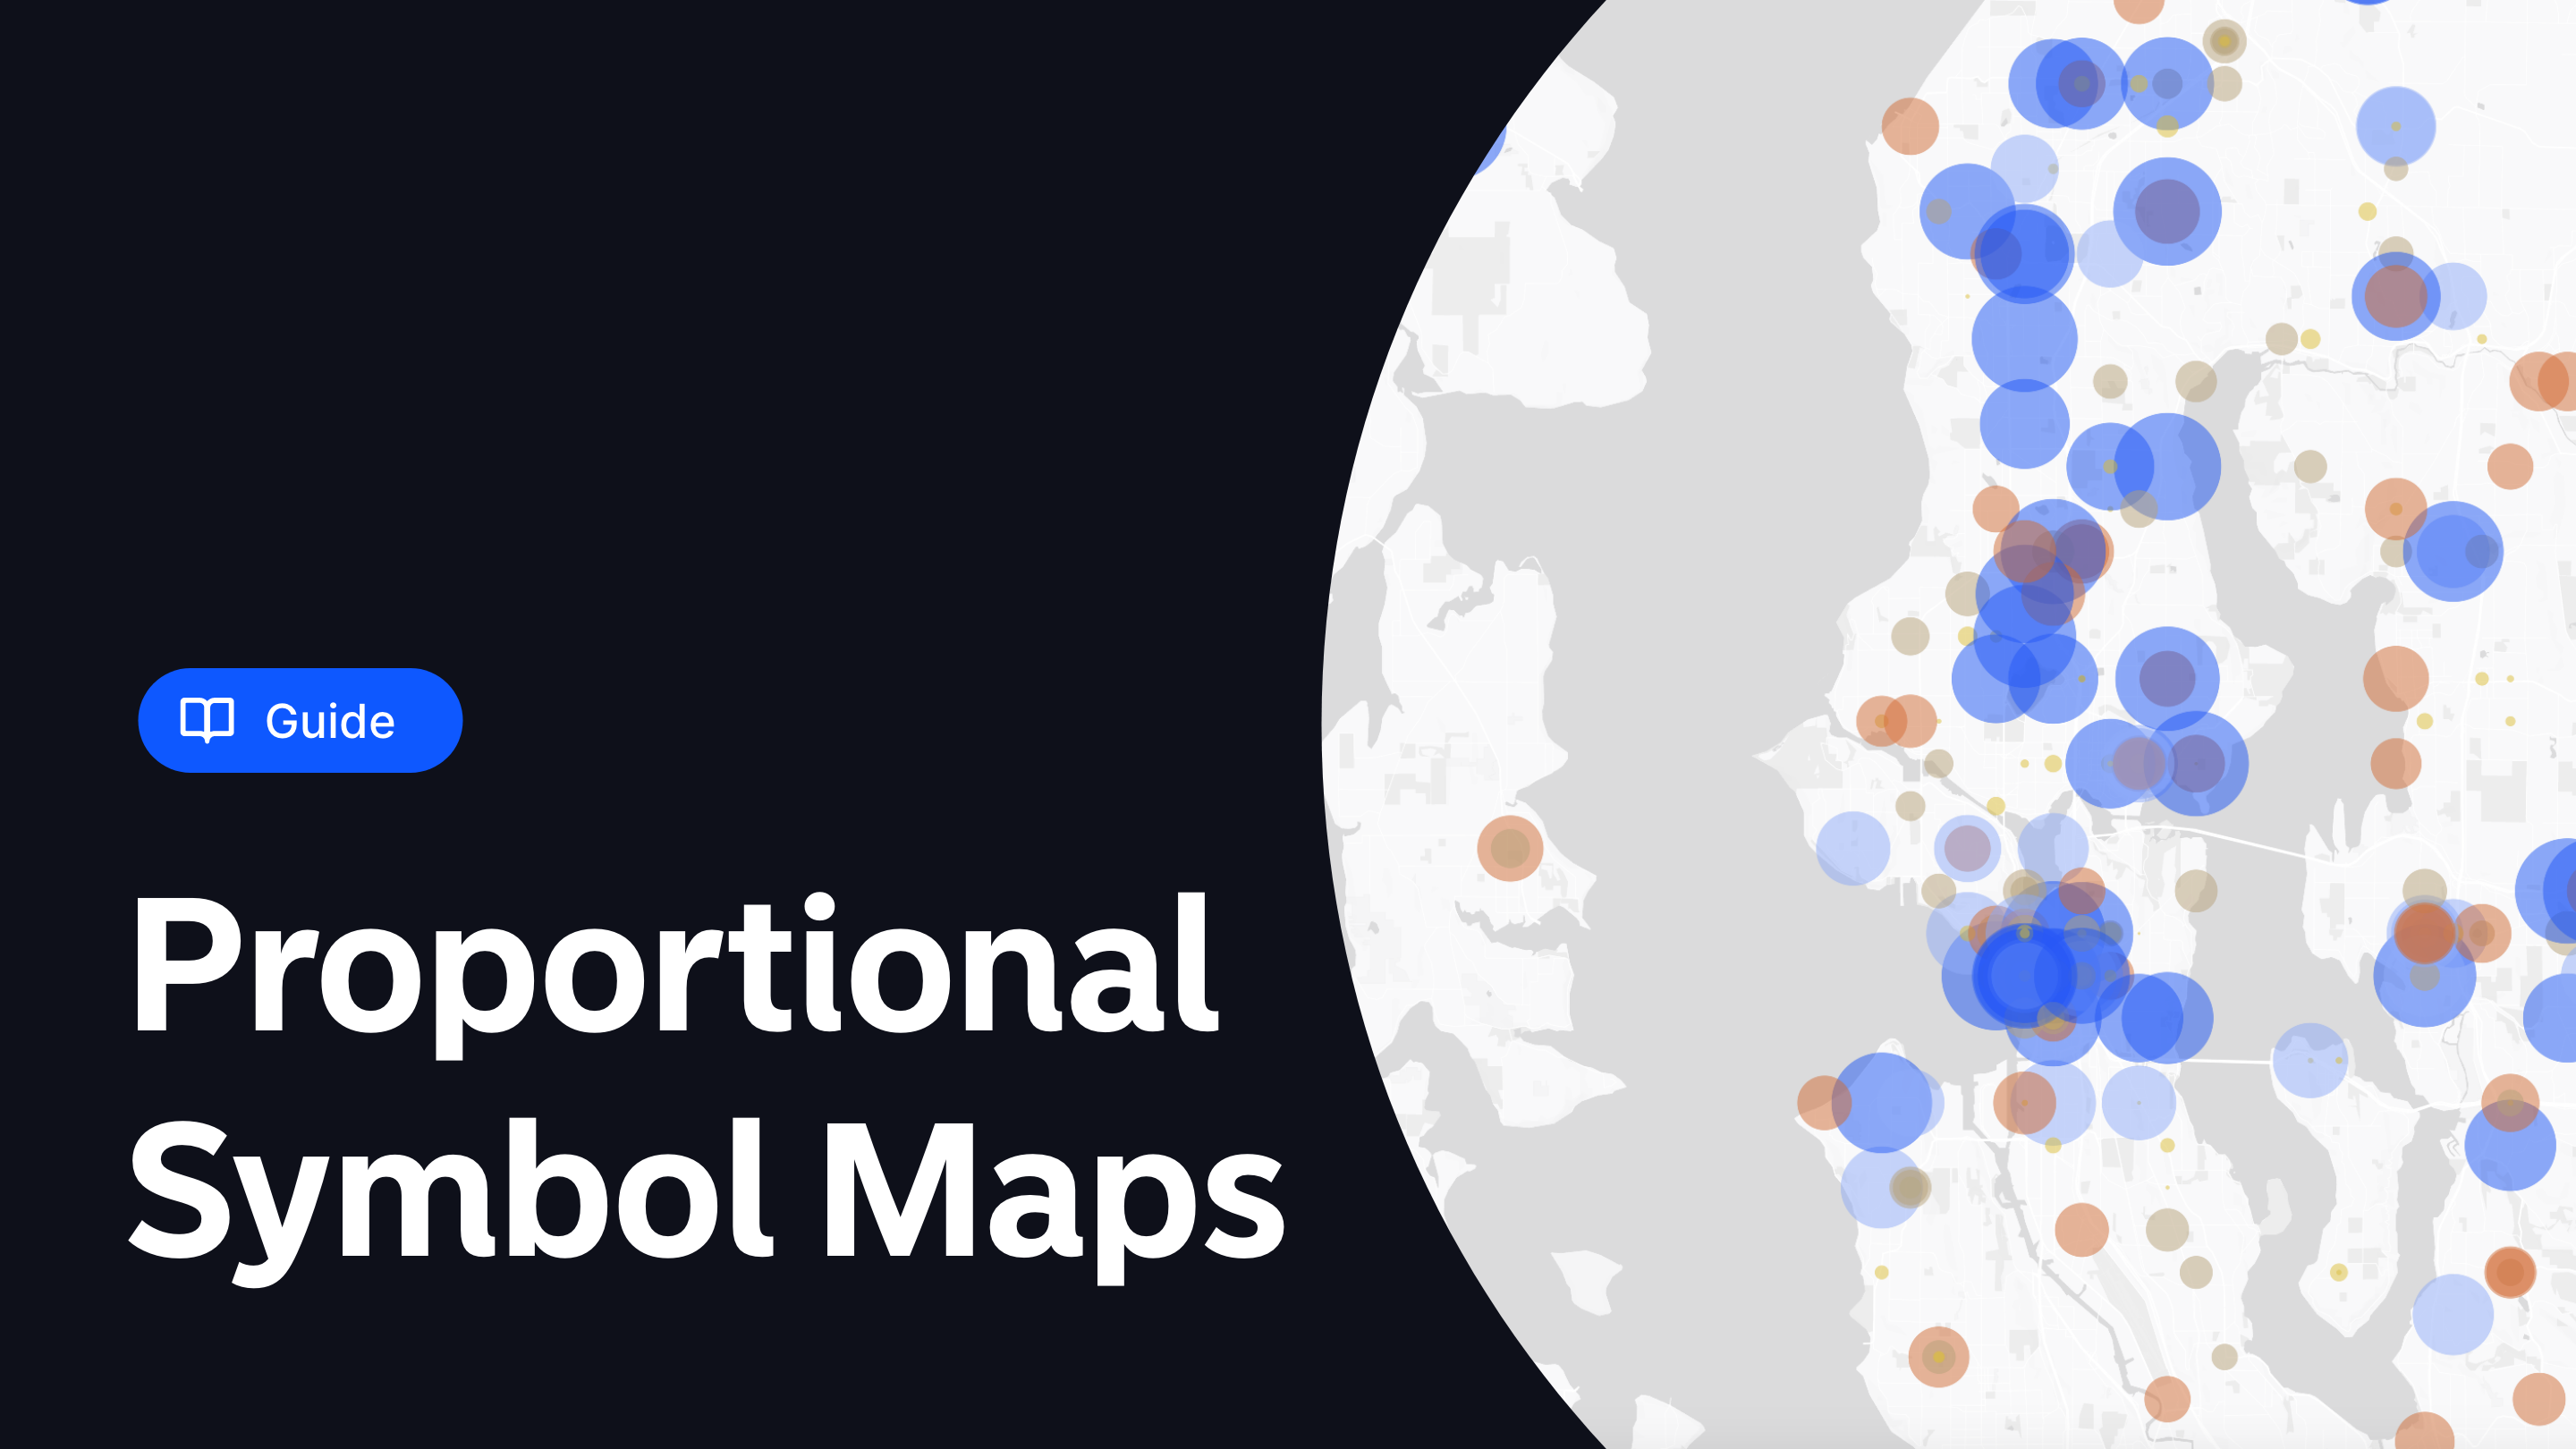
What is a Proportional Symbol Map?
Proportional Symbol Maps excel in this area by offering a blend of simplicity and depth. They transform raw data into engaging visuals, making it easier for both GIS professionals and stakeholders to understand spatial patterns and data distributions.
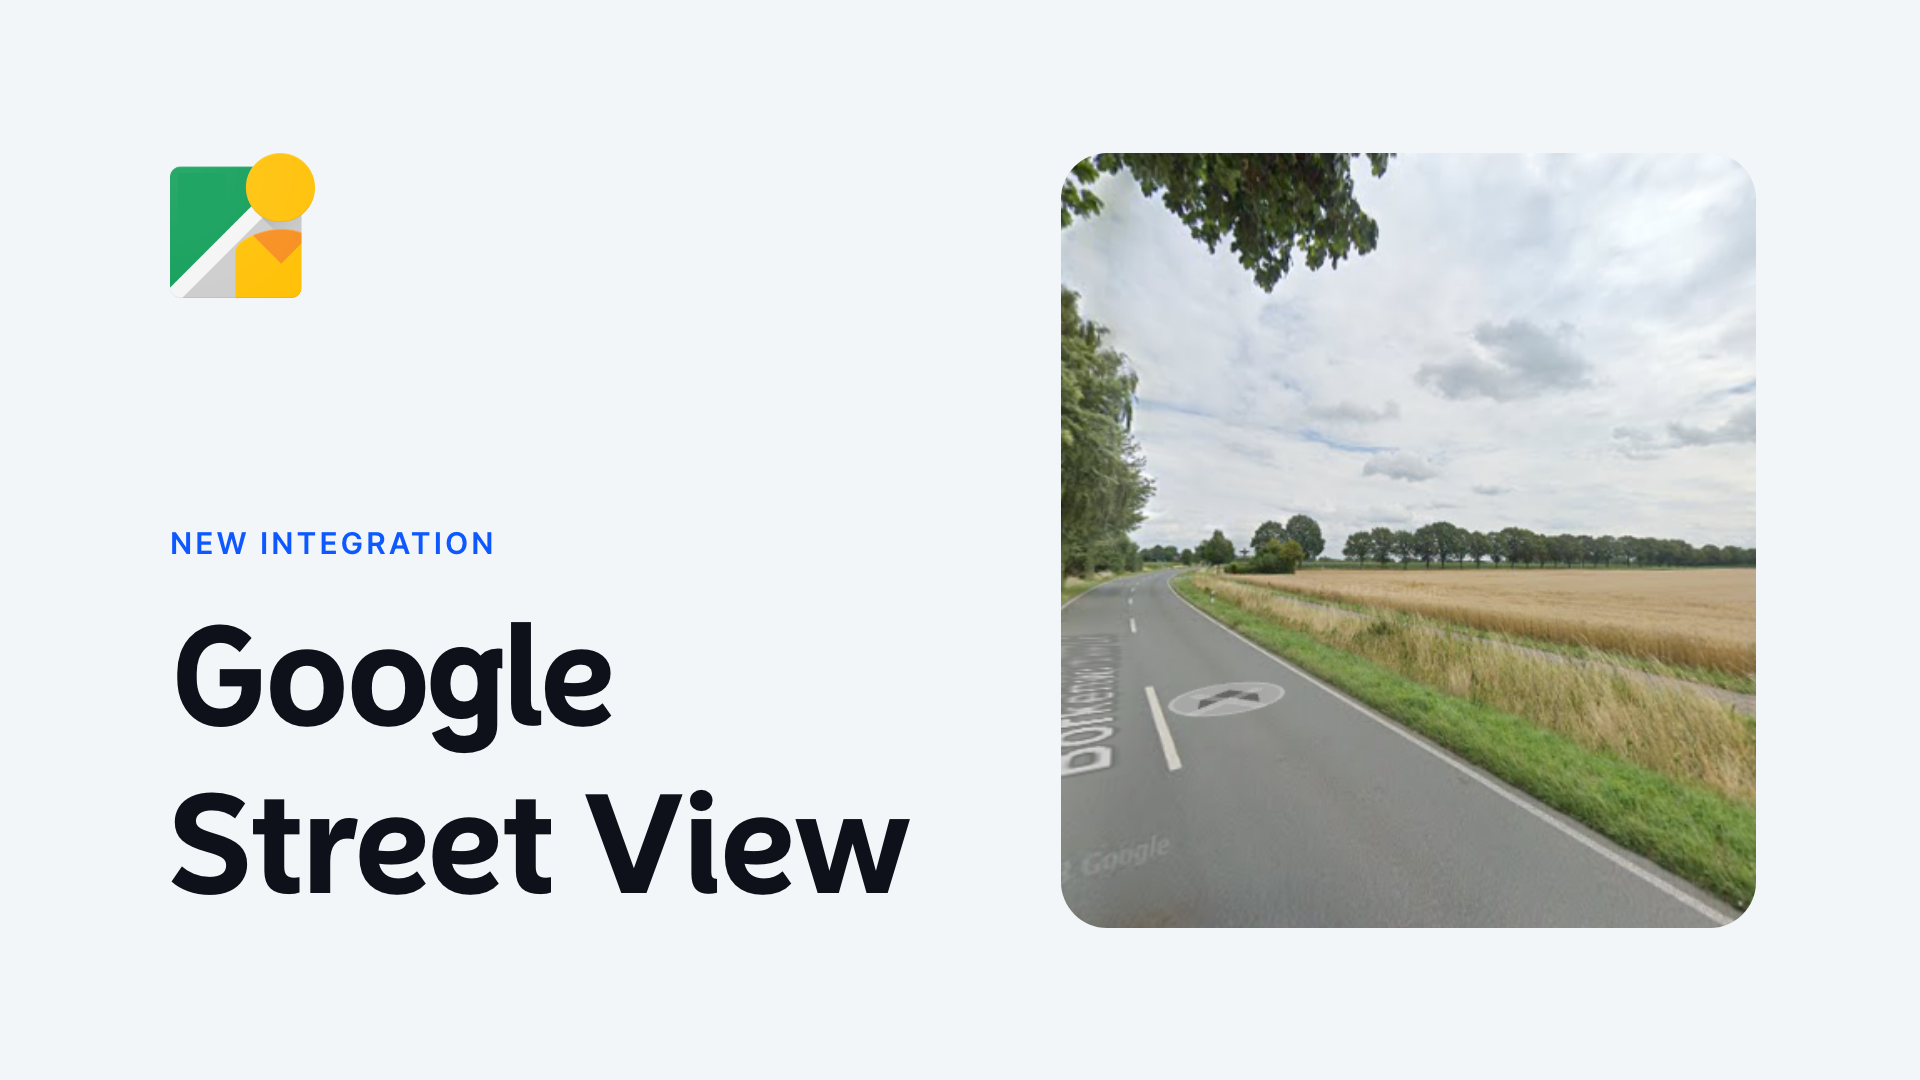
New in Atlas: Google Street View
We're excited to announce a new integration in Atlas: Google Street View! Whether you're a city planner, a developer, or simply a GIS enthusiast, this feature aims to enrich your projects with more contextual, real-world visuals.
![Travel Time Analysis [Complete Guide + 8 Examples]](https://www.atlas.co/images/posts/travel-time-analysis-hero.png)
Travel Time Analysis [Complete Guide + 8 Examples]
The Travel Time Analysis tool is used to compute the region accessible within a designated travel time or distance along a street network, depending on the chosen travel mode.

Shade Analysis is here!
The Shade Analysis enables you to simulate, visualize and analyze sunlight and shadow in any location on the globe! Whether you're evaluating a single building or an entire cityscape, this tool provides detailed visualizations of how shadows fall at different times of the day and year, offering invaluable insights into the play of light and shade in our living spaces.
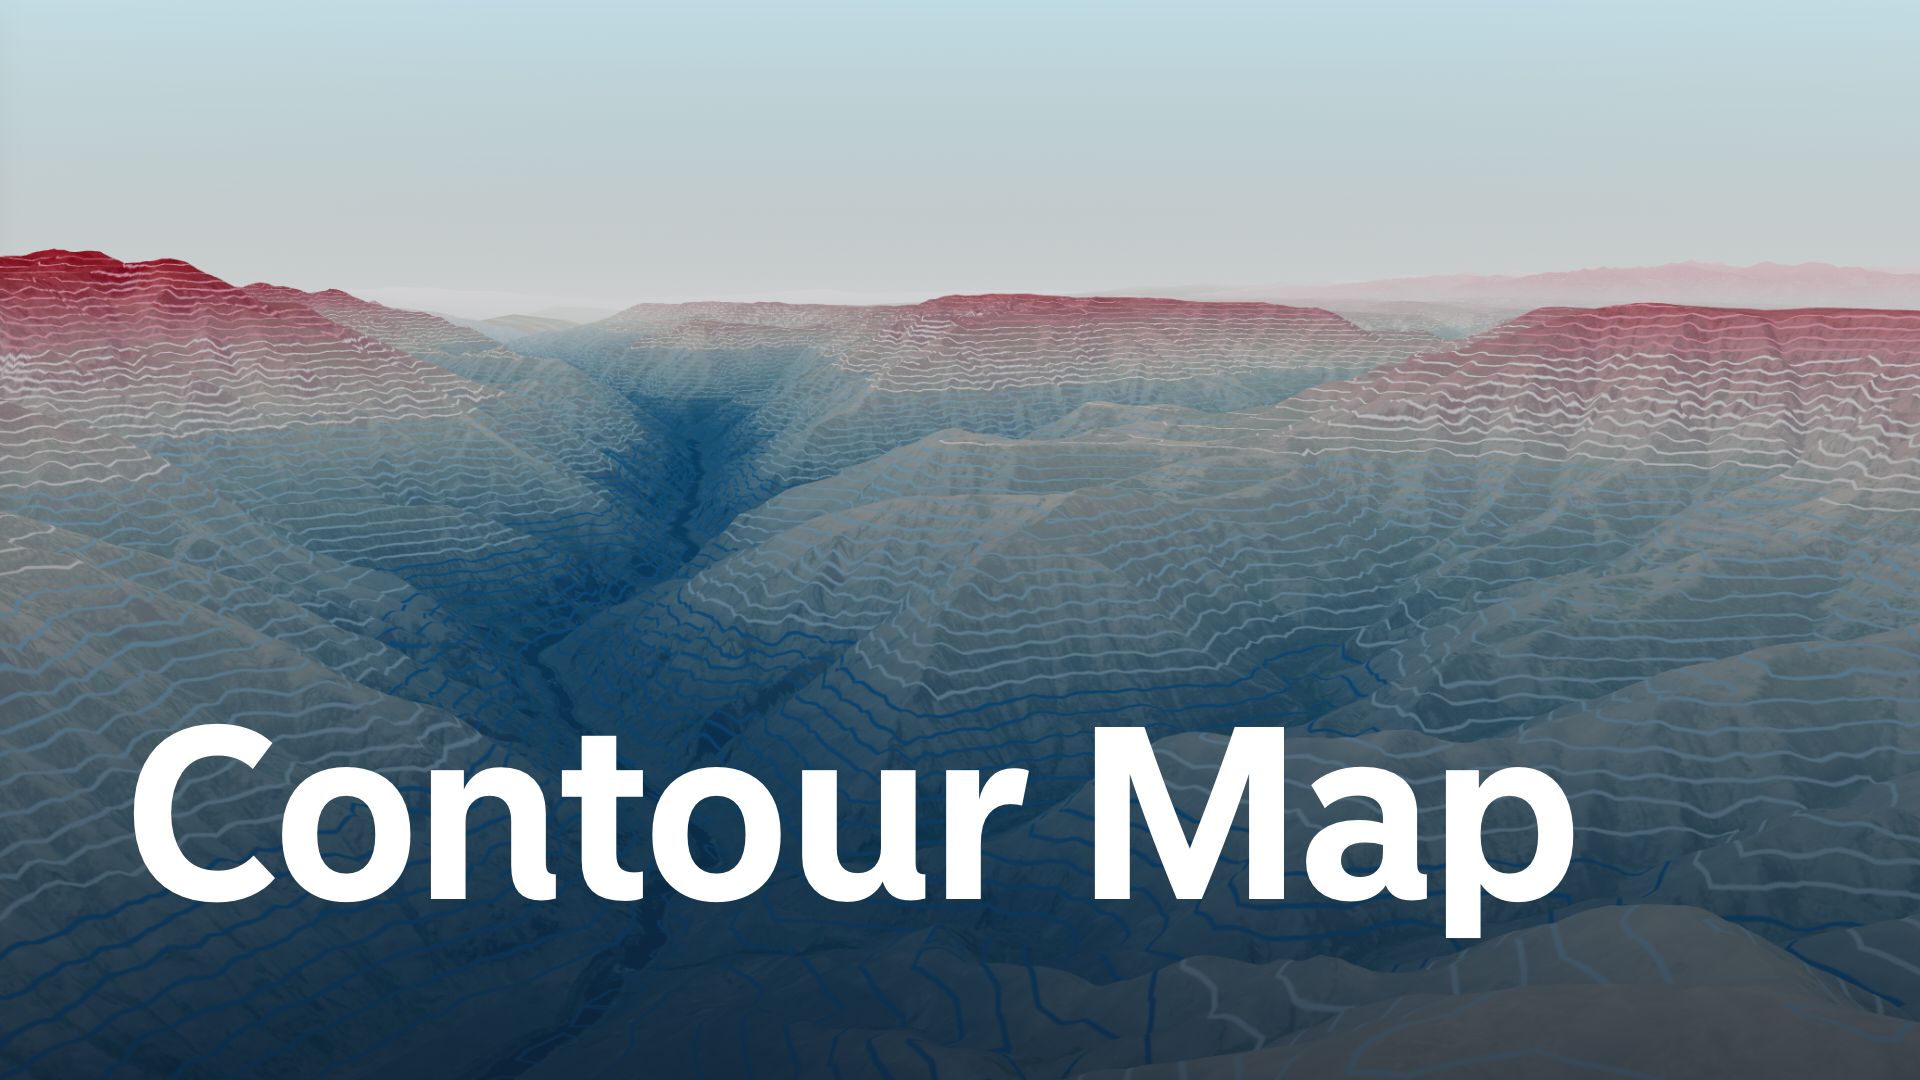
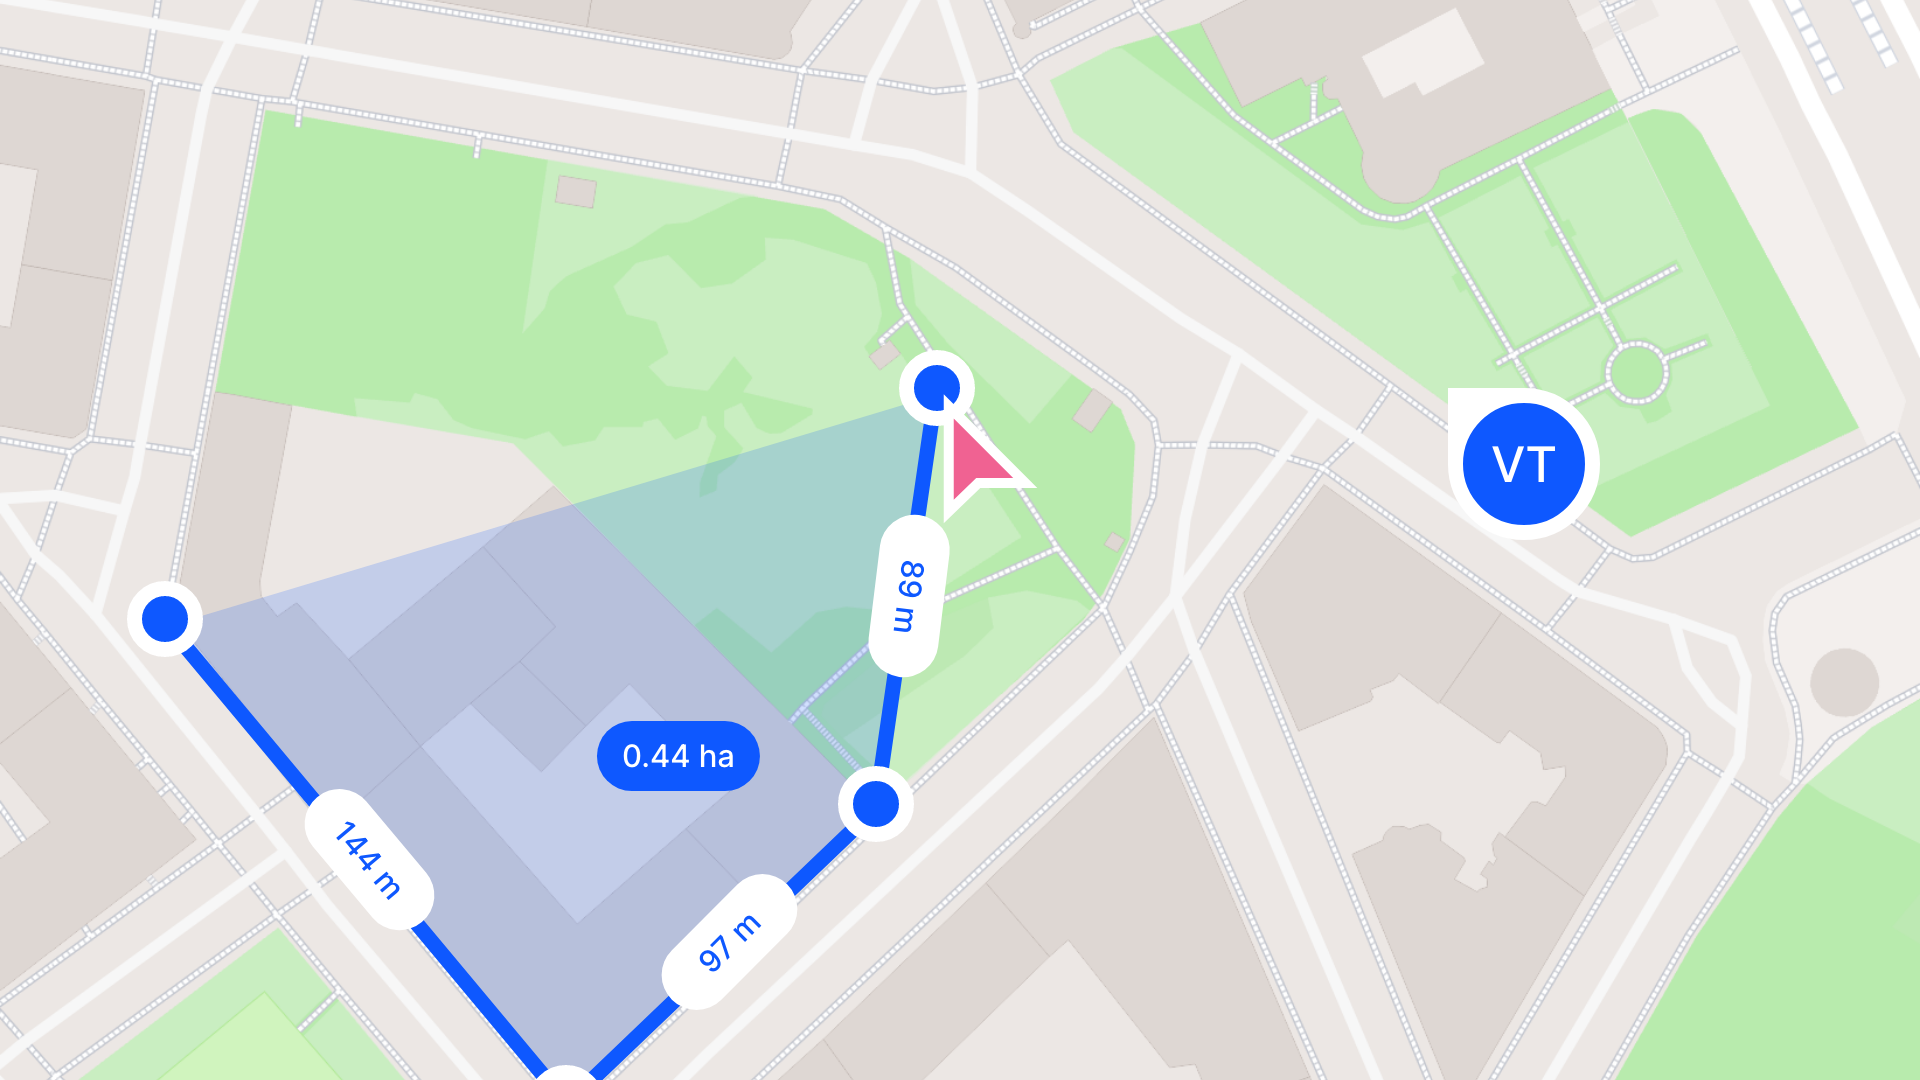
What is a Contour Map & How to Create it
A contour map is a graphical representation of the terrain or surface of an area. Instead of showing mountains, valleys, and other features in 3D, it uses lines, called contour lines, to represent these features in 2D.
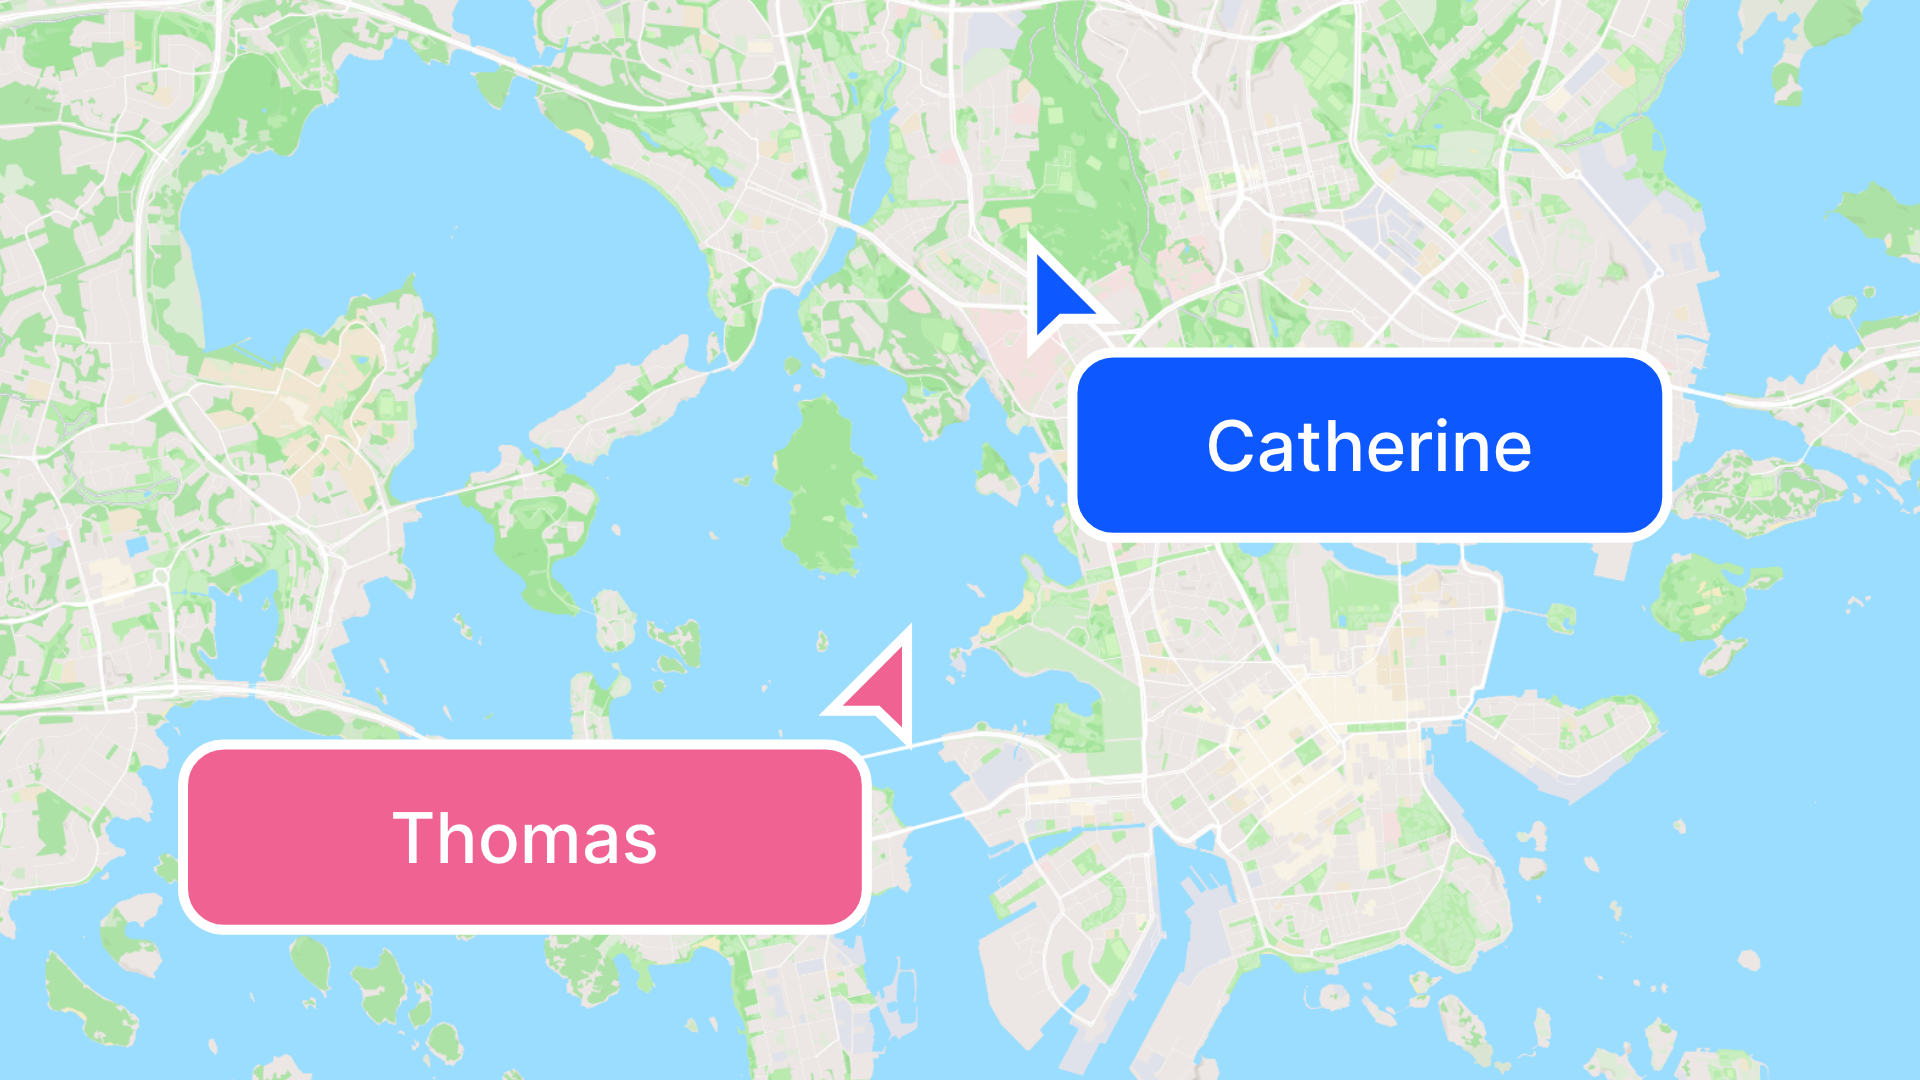
Introducing: Collaborate in Real-Time with Atlas!
We're excited to announce a new update to Atlas: Real-Time Collaboration! Real-Time Collaboration brings together teams spread across different locations, enabling them to work on the same project simultaneously. With this update, we're not just enhancing our software; we're redefining the standards of collaborative GIS projects.
Raster vs. Vector Data: The Ultimate Guide
Understanding the difference between vector and raster data is fundamental for GIS. These two types of spatial data are the backbone of GIS analyses and mapping, each with its unique characteristics, advantages, and applications.
Collaborative GIS to Increase Productivity
Browser-based GIS software has revolutionized the way GIS users engage with geospatial data, enabling seamless collaboration and enhancing productivity. Unlike traditional desktop GIS software that requires substantial processing power and technical expertise, browser-based GIS offers a lightweight and agile solution that is accessible to a broader audience.
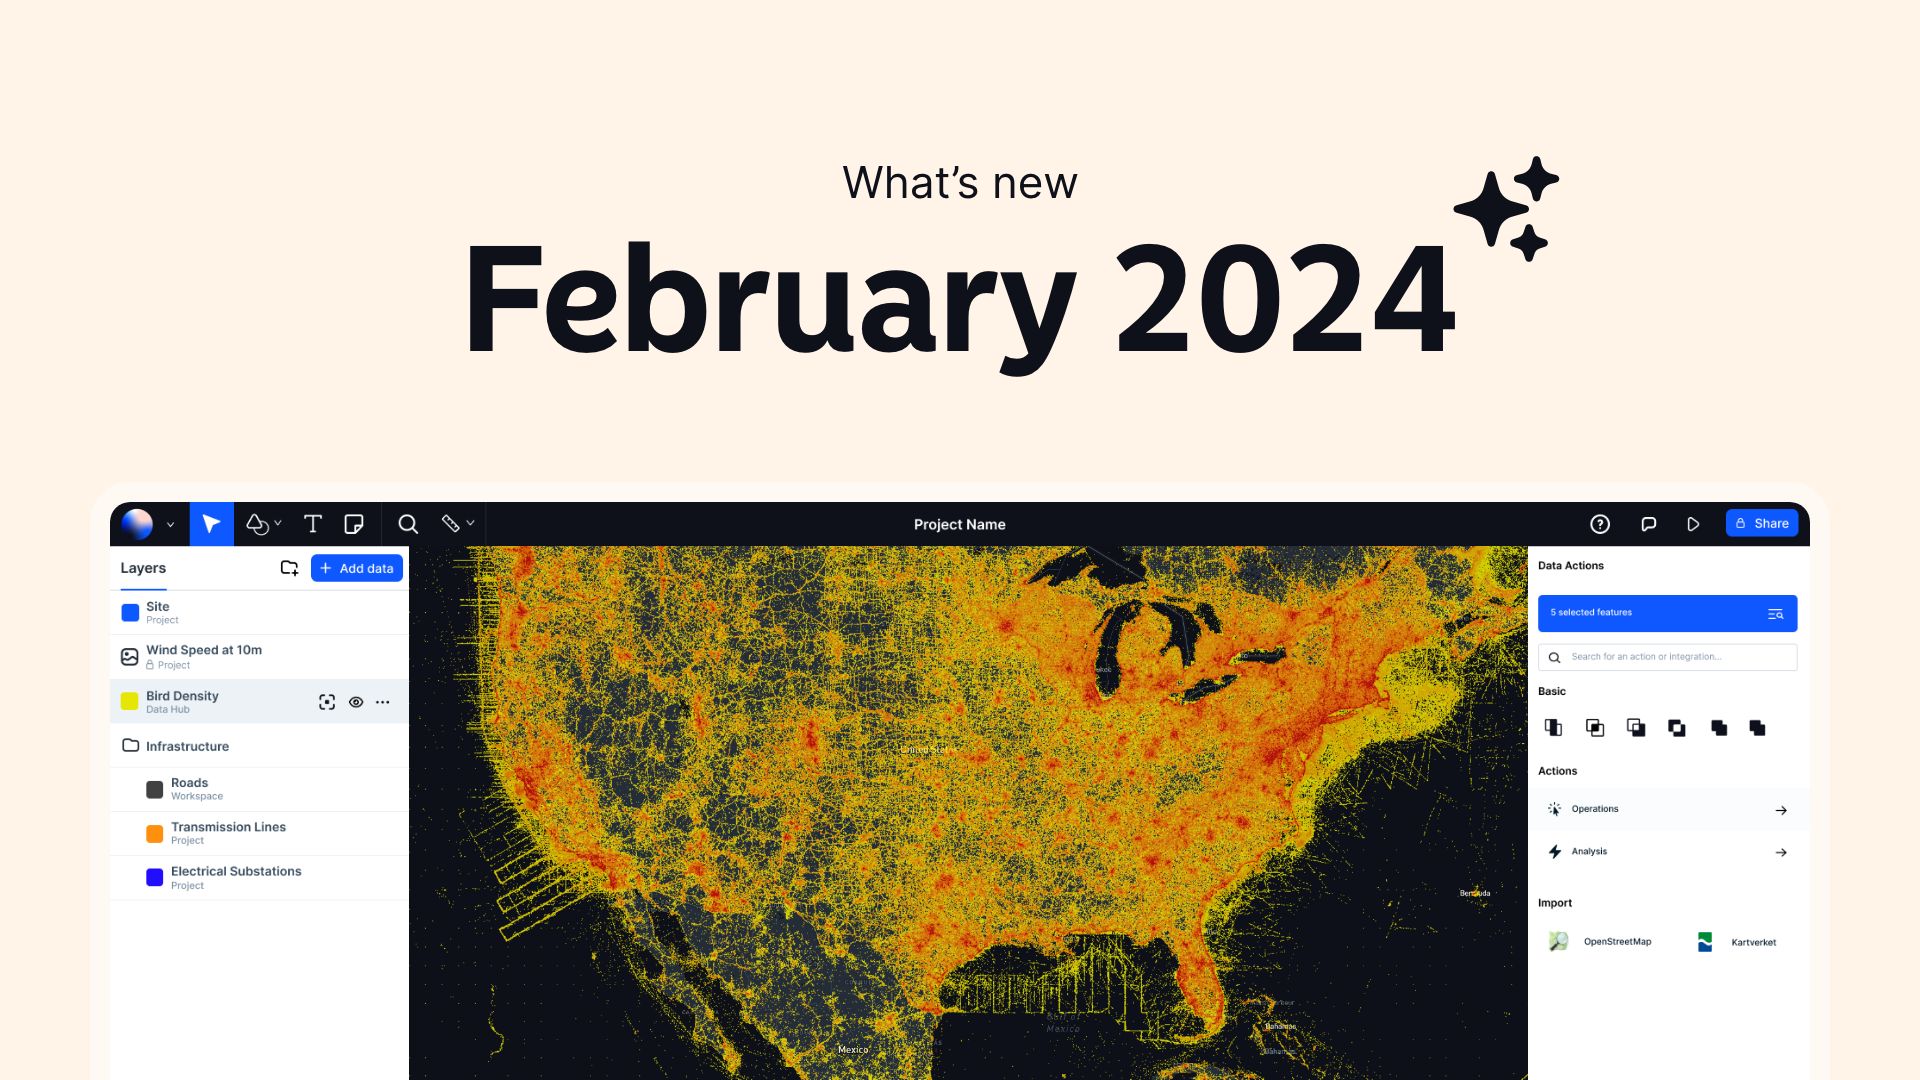
Release Notes: February 2024
In Atlas, you can share files in your workspace, where the files are in sync across all projects. No more juggling between various platforms, email threads or struggling to keep track of scattered resources.
Organize Your Projects with Nested Folders
You can now create nested folders to better organize your data! Nothing worse than creating the perfect map and then the datasets you’re looking for gets lost and pushed towards the bottom as you create more and more layers. Well, that time has come to an end!
Shared Datasets in your Organization
In Atlas, you can share files in your workspace, where the files are in sync across all projects. No more juggling between various platforms, email threads or struggling to keep track of scattered resources.