
Heatmaps, or isorhythmic maps, display dense amounts of points as a painted cluster. It’s visually stimulating and shows gradients of concentrations.
Make Points Easier to Understand
If you’ve ever thought “I have too many points on this map, I can’t see the forest from the trees” a heatmap is there for you. A heatmap takes all of those points and calculates a density surface. It can reduce overwhelming complexity into something understandable and beautiful.
 Solar PV Installations in Europe
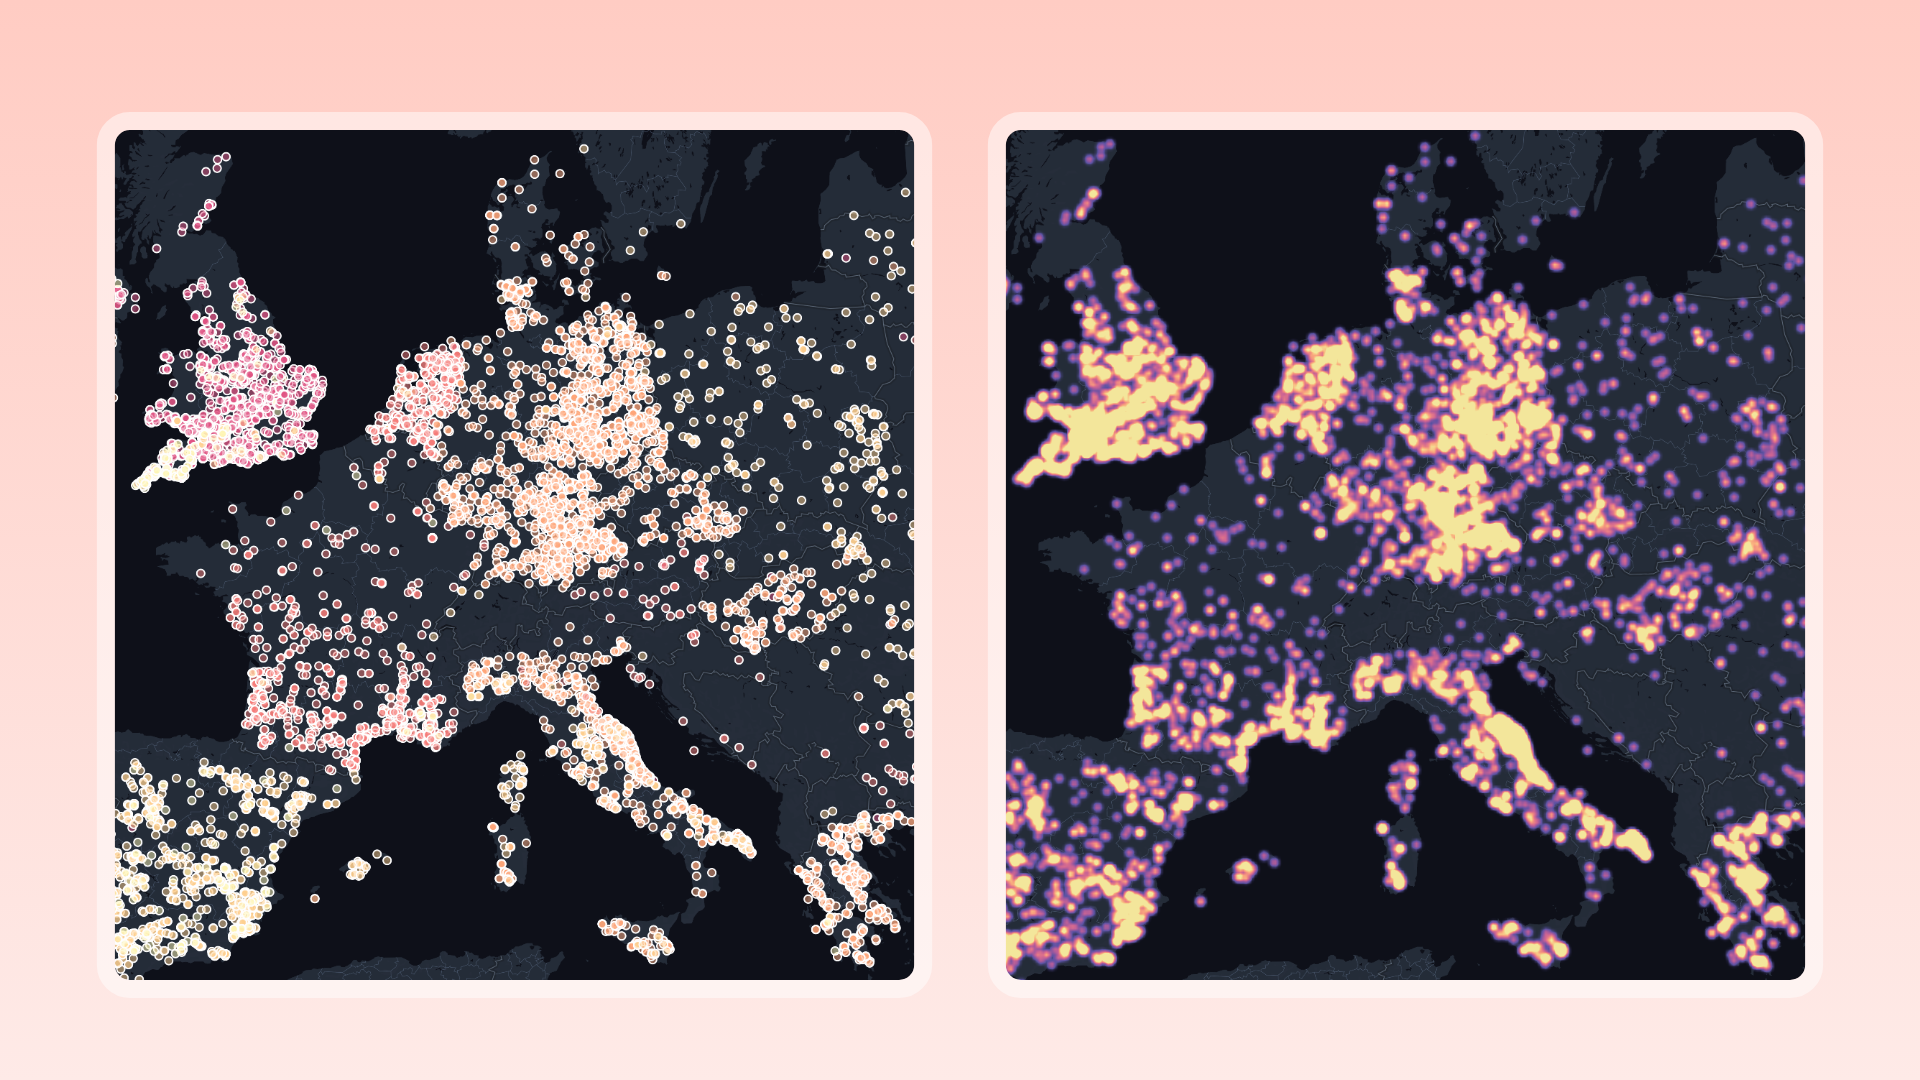
The example above show all of the solar PV installations in Europe. However, since the original feature layer contains over 27k installations it is hard to gauge density differences once the symbols start to overlap. Turning these point symbols into a heatmap reveals far more detail about the relative density of installations. The brighter the color show where more installations are clustered together.
Two Quick Steps
Smart mapping helps you create beautiful and informative maps, quickly by suggesting appropriate mapping styles for your data. If you have point data, heat map will be a suggested style option.
- Select the Heatmap layer type
- Explore the Style options to adjust color and intensity
Color Palette
Defines the color range that selects the color of each pixel based on its density value in the Heatmap. Currently, we've defined more than 30 beautiful color palettes to choose from.
Intensity
This property allows you to adjust the intensity of the Heatmap appearance globally. The higher the value, the more “weight” each point will contribute to the look.
Radius
Radius of influence of one heatmap point in pixels. Increasing the value makes the heatmap smoother, but less detailed.
Weight
A measure of how much an individual point contributes to the heatmap. The relation is linear — e.g., setting heatmap-intensity to 10.0 is equivalent to duplicating the dataset ten times and rendering it with the default 1.0 value. Especially useful when combined with clustering.
Tips and Tricks
- Avoid Heatmaps if you have only a few point features; instead, map the actual points.
- Add a duplicate of the point layer again on top of your existing Heatmap layer for information and reference. Adjust the layer visibility so the points only appear when zoomed in.
Want to Try it Out?
We invite you to explore the power of Heatmaps. Whether you're a GIS expert, an environmental enthusiast, or a professional navigating urban development, this feature is here to revolutionize the way you interact with maps.
Welcome to a new era of map interaction!

