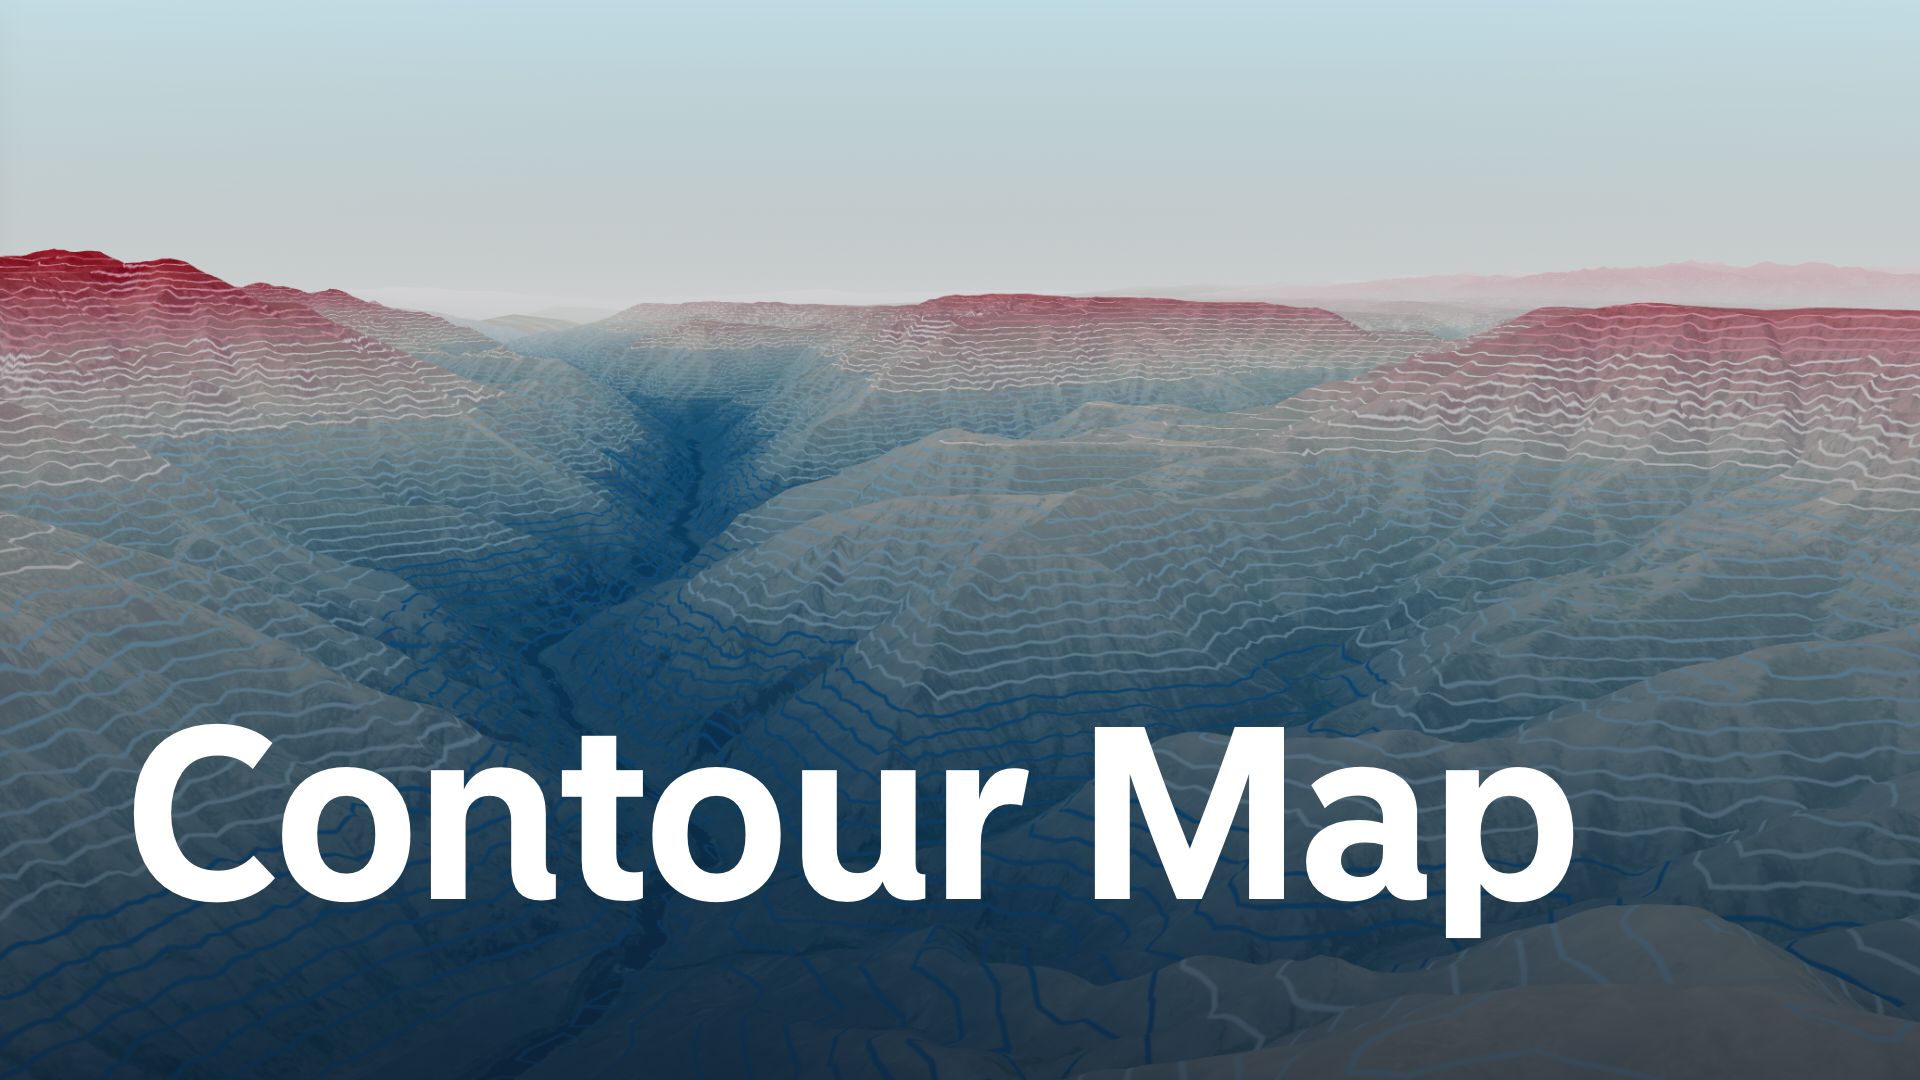
A contour map is a graphical representation of the terrain or surface of an area. Instead of showing mountains, valleys, and other features in 3D, it uses lines, called contour lines, to represent these features in 2D.
What are Contour Lines?
Contour lines are continuous lines that connect points of equal elevation. This means that if you were to stand anywhere along a particular contour line, you’d be at the same height above sea level.
- Every point on a contour line represents the same elevation.
- Contour lines never cross each other.
- The closer the contour lines are to each other, the steeper the terrain. Wide gaps between contour lines indicate a gentler slope.

Understanding Contour Intervals
The difference in elevation between two consecutive contour lines is called the contour interval. For example, if one contour line represents 30 meters above sea level and the next one represents 40 meters, the contour interval is 10 meters.
Types of Contour Lines
- Index Contours: These are the thicker contour lines that are labeled with their elevation. They are used to make the map readable and to help locate and trace other contour lines.
- Intermediate Contours: Lines that fall between the index contours. They provide finer details about the terrain.
- Supplementary Contours: These are dashed lines that appear where there’s a sudden change in the terrain, such as a flat area within a steep hill. Visualizing Contour Lines
Imagine slicing through a mountain horizontally, at regular intervals, and then looking at it from above. Each slice would represent a contour line on the map.
How to Read Contour Lines on Topographic Maps
Understanding and interpreting contour lines can initially seem challenging, but with some basic knowledge and practice, it becomes quite intuitive.
Here’s a step-by-step guide:
- Identify the Contour Interval Before diving into the details of the map, locate the contour interval. This is often found in the map’s legend or key. The contour interval tells you the elevation difference between consecutive contour lines.
- Look for Index Contours These are the bolder lines on the map and are usually labeled with their elevation. They act as a reference to help you determine the elevation of other lines.
- Determine the Direction of Elevation Generally, as you move from one contour line to the next: If you’re going toward the center of a set of concentric lines, you’re moving uphill. If you’re moving outwards, you’re going downhill. Another hint is the elevation numbers on index contours. If the numbers are increasing, you’re going uphill, and if they’re decreasing, you’re going downhill.
- Assess the Steepness The distance between contour lines indicates the steepness of the slope. Close together: Steep slope Far apart: Gentle slope
- Identify Terrain Features Hills: Represented by concentric circles. The innermost circle is the peak. Valleys: These are U-shaped or V-shaped contour lines pointing towards higher elevation, indicating a low point surrounded by higher land. Ridges: These are also U-shaped or V-shaped but point towards a lower elevation. Depressions: These are represented by concentric circles with hachures or small lines pointing inwards, indicating a sunken area or hole. Rivers and Streams: These are usually found in V-shaped valleys. The V always points towards the source or higher ground, indicating the direction of flow.
- Use Supplementary Features Apart from contour lines, maps will often have features like shading, colors, or gradient fills to indicate elevation changes, water bodies, forests, etc. These can give additional context.
How to Create a Contour Map in 3 Steps
Step 1: Query a Digital Elevation Model (DEM) for your area of interest
First, we need to query a Digital Elevation Model (DEM) for the area of interest. A DEM file is a digital cartographic dataset that represents a continuous topographic elevation surface through a series of cells. Each zell represents the elevation (Z) of a feature at its location (X and Y).
Step 2: Run the contour line analysis
Once you have the DEM file, navigate to Data Actions and search for contour. Select the newly created DEM file as input and 10 meters as the resolution. This will result in a contour line for every 10 meters of elevation. Run the same analysis for 50 meters to create index contour lines. We’ll talk more about index contour lines in the next step.
Step 3: Visualizing contour lines
There are three types of contour lines we should think about in terms of visualization:
- Index contours: These are the thicker contour lines that are labeled with their elevation. They are used to make the map readable and to help locate and trace other contour lines.
- Intermediate Contours: Lines that fall between the index contours. They provide finer details about the terrain.
- Supplementary Contours: These are dashed lines that appear where there’s a sudden change in the terrain, such as a flat area within a steep hill.
First, we want to focus on the index contours, the 50 m contour lines. Select the layer and navigate to styling. In the styling panel, we want to:
- Base the color on the elev parameter.
- Set the outline width to 2 px.
-
Add a text label based on the elev parameter.
- Set the text size to 12 px.
- Remove text stroke width.
- Set placement to line.
Secondly, we want to focus on the intermediate contours, the 10 m contour lines. Again, select the layer and navigate to the styling. In the styling panel, we want to:
- Base the color on the elev parameter.
- Set the outline width to 1 px.
- Set the opacity to 50%.
Conclusion
Contour maps are an essential tool in various fields such as geology, geography, civil engineering, and more. They provide a way to visualize the topography of an area without having to see it in 3D, making it easier to plan, study, and understand the terrain.

![Travel Time Analysis [Complete Guide + 8 Examples]](https://www.atlas.co/images/posts/travel-time-analysis-hero.png)