The Map Editor is, without exaggeration, the core of Atlas. It’s where you craft your projects and where you’ll likely spend time the most.
You might have already created your first map in Atlas when you first signed up, but it’s worth going through the map editor in a little more detail. The map editor has many elements common to other map-making and GIS software, but also some unique features too.
Top Bar Navigation
The Top Bar gives you access to some of the most essential tools you need in Atlas. Let’s find out what some of these tools are for.
Editor Tools
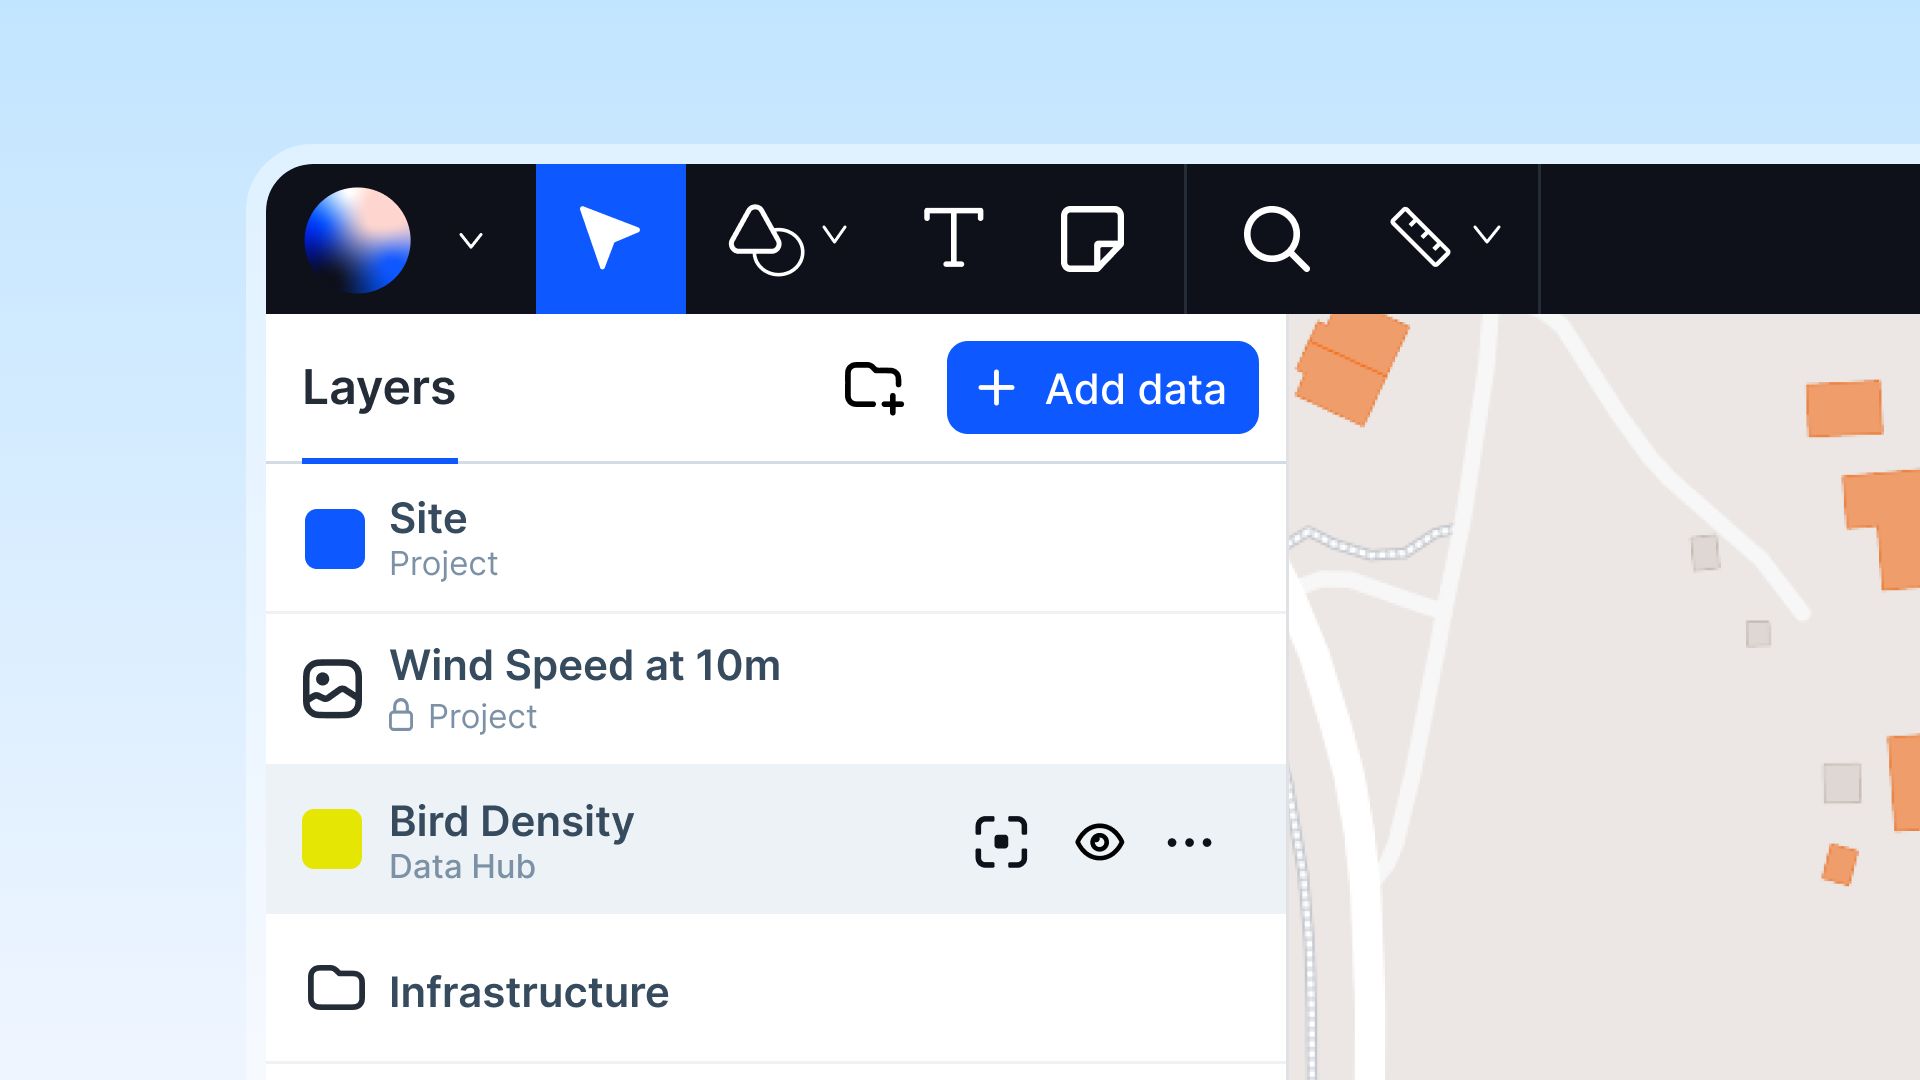
Depending on your user type and access level, you will find all editor tools in the top-left corner of the Editor view. The following tools are currently available:

- Pointer
-
Create geometry
- Polygon (shortcut: O)
- Line (shortcut: L)
- Point (shortcut: P)
- Circle (shortcut: I)
- Draw (shortcut: M)
- Add Text Annotation (shortcut: T)
- Add Note Annotation (shortcut: N)
- Search (shortcut: S)
-
Measure distances
- Straight
- Walking
- Cycling
- Driving
Project Name Input
In the center of the Top Bar Navigation, you will find the Project Name Input field. You can easily edit the name of the project by hovering the text and write a new name.
Present & Collaborate Tools
In the top-right corner of the screen, you’ll find the Present and Collaborate Tools. Here, you will be able to Get Help, Add Bookmarks, Add Comments, Enter Preview mode or Share the map.

Using the preview button, you can preview your map before sharing it anywhere, allowing you to test the map beforehand.
You can share your map publicly (what you see in your preview) or share it privately with co-workers to enable collaboration and feedback on your maps.
Left Sidepanel
The Map Editor can be set in either of three modes:
- Editor Mode: where data can be added, geometries can be drawn and edited, layer styled and analyses performed
- Present Mode: where you can customize how your map should be presented to the visitors of the map
- Preview Mode: where the map is rendered and presented for visitors without editor access
At the bottom of the left sidepanel you’ll find the option to select between Editor Mode and Present Mode. Notice that the change influence which tools that are available in the Top Bar Navigation and what is shown in the Right Sidepanel.
Editor Mode
When in Editor Mode, the Left Sidepanel is the home of the layers that are displayed in the map. You can control which layers that is hidden, the order of the layers, see the legend of each layer and edit layers.
Present Mode
When in Present Mode, the Left Sidepanel let’s you create and adjust widgets that are displayed in the Preview Mode. This can be statistics, graphs and diagrams to present information and insights from the data in the map.
Right Sidepanel
The Right Sidepanel displays data actions and details regarding the data in the map. This is where you customize layers, perform analysis or explore a feature in detail.
Data Table
The Data Table is the container that displays all attribute values of a layer. To open a data table, click on the ellipsis menu of a layer and select Data Table.
The Data Table is then displayed on the bottom of the screen in the middle of Left Sidepanel and Right Sidepanel.
Map
The Map is the core view of the Map Editor.
To optimize your experience, familiarize yourself with the following navigation features:
- Pan: Easily navigate across the map by clicking and dragging. This allows you to move seamlessly through different geographic areas and focus on specific regions of interest.
- Zoom In and Out: Utilize the zoom functionality to get a closer look at intricate details or gain a broader perspective of the entire landscape. Use the mouse scroll wheel or on-screen controls to adjust the zoom level effortlessly.
- Basemap Selection: Customize your map's appearance by selecting from a variety of basemaps. Whether you prefer satellite imagery, street maps, or topographic views, the platform offers a diverse range of basemap options to suit your specific needs.
- 3D Mode Toggle: Enhance your visualization capabilities by toggling into 3D mode. This feature transforms the map into a three-dimensional representation, providing depth and dimension to your spatial data.
- Map Scale: Stay informed about the spatial scale of your view with the map scale indicator. This valuable tool ensures that you have a clear understanding of distances and proportions, aiding in accurate analysis and interpretation.